UPDATE: Google now has a built-in tool for doing this. Simply add the following: _gaq.push([‘_trackPageLoadTime’]); and hey presto: Page-load-speed tracking. See this page for more info, including an important caveat. With Google now including Page Load speed in their page-ranking algorithm, many of our clients started asking us how fast their sites load. There’s lots of developer tools that can help with this - I use (alternately) the Google Page Speed tool and Yahoo! YSlow during development to tweak page load times. But this doesn’t help our clients very much. There’s a chart you can use on Google Webmaster Tools, but overall, I don’t find Webmaster Tools particularly end-user friendly. As it’s name implies, I’m not sure that it is supposed to be. A couple of our more technical clients use it, but most don’t use it, or don’t really get it. The chart that Google Webmaster Tools spits out can be found under “Labs”, then “Site Performance”. It looks like this:
- Fast (less than 1500 MS) (because Google, according to Webmaster Tools, considers anything 1.5s or faster “fast”.
- Acceptable (less than 3000 MS)
- Middling (less than 5000 MS)
- Slow (less than 10000 MS)
- Unacceptable ( 10000 MS or longer)
These groupings are completely arbitrary - I could have set them at any time span. Those just seemed reasonable to me, based on knowing that most of our sites have an average load time of 2800 MS, based on our internal tools. So then I had to track it. The code is as follows:
var pageLoadStart = new Date();
window.onload = function() { var pageLoadEnd = new Date(); var pageLoadTime = pageLoadEnd.getTime() - pageLoadStart.getTime(); // let’s set some second (1000s of ms) segments if (pageLoadTime < 1500) loadStatus = ‘Fast (less than 1500 ms)’; else if (pageLoadTime < 3000) loadStatus = ‘Acceptable (less than 3000 ms)’; else if (pageLoadTime < 5000) loadStatus = ‘Middling (less than 5000 ms)’; else if (pageLoadTime < 10000) loadStatus = ‘Slow (less than 10000 ms)’; else loadStatus = ‘Too Slow (more than 10000 ms)’; var myPath = document.location.pathname; if( document.location.search) myPath += document.location.search; // round the time to the nearest 10 ms. pageLoadTime = Math.round(pageLoadTime / 10) * 10; // send the GA event try { _gaq.push([‘_trackEvent’, ‘Page Load’, loadStatus,myPath,pageLoadTime]); } catch(err) {} }
Some Notes:
- I have the first line (var pageLoadStart = new Date();) at the very top of my header, right after the tag. The window.onload() function sits in the footer.
- I round my values to the nearest 10 MS - but this might be too many values, too noisy. So you could round to the nearest 100 MS or even nearest second if that worked better for you.
- the document.location.pathname just passes the page’s address to Google, so I can see which pages are slow, or when particular pages or slow.
- You can only send integers to the Event Tracking widget.
- the _gaq.push() line is where I send this to Analytics. You might have your Analytics tide to a different variable, in which case change the _gaq to whatever you use. For more on how event tracking works, see the docs
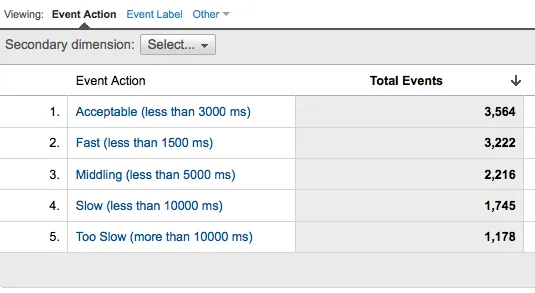
What my client then sees in Google analytics is a chart like this (note - I’m using the new version of Analytics - yours might look different):


